THIS TABULAR DATA RELATES TO THE PAPER ABSTRACTED FROM THE SCRUTINEERED VETERINARY JOURNAL EQUINE VETERINARY JOURNAL
Equine vet. J. (1999) 31. 5. pp 433-442

RADIOLOGICAL MEASUREMENTS FROM THE FEET OF NORMAL HORSES WITH RELEVANCE TO LAMINITIS.

P.J. CRIPPS B.V.Sc. B.Sc. M.Sc. PhD. MRCVS.

The Laminitis Clinic, Mead House Farm, Dauntsey, Chippenham, Wiltshire. SN15 4JA.

ROBERT A EUSTACE B.V.Sc. Cert.E.O. Cert.E.P. FRCVS.

University of Liverpool, Department of Veterinary Clinical Science and Animal Husbandry, Leahurst, Neston, South Wirral, L64


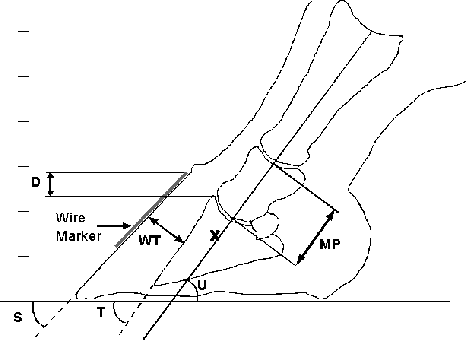
Figure 1: Diagram to show how the Various Radiographic Measurements were made

Key:
D = Founder distance, WT = Wall Thickness (both before correction for magnification)
Angles S, T, & U; Angle R is T minus U; Angle H is T minus S.
X = Position at which the X-ray beam was aimed.


Table 1. Physical details of normal animals.

Animal Code

Sex

Age (years)

Height (cms)

Breed

Use/ Type

N1

M

Aged

150

TB x

Experimental

N2

M

Aged

155

TB x

Experimental

N3

M

Aged

165

TB/ID

Experimental

N4

M

Aged

120

Pony

Experimental

N5

G

Aged

155

Pony

Experimental

N6

S

5

165

Hanoverian

Eventing

N7

M

7

155

Argentinian

Polo

N8

G

8

160

Anglo Arab

Riding School

N9

G

Aged

155

Cob

Hunter

N10

G

12

155

Anglo Arab

Riding School

N11

G

12

170

TB

Riding School

N12

G

13

164

TB

Riding School

N13

G

Aged

147

Connemara

Pony Club

N14

M

14

162

TB x

Brood mare

N15

S

18

166

Hanoverian

Dressage

N16

M

4

172

Hanoverian

Brood mare

N17

S

4

165

Hanoverian x TB

Eventing

N18

M

12

160

Hanoverian

Brood mare

N19

M

11

170

Hanoverian

Brood mare

N20

G

8

163

TB

Racing

N21

G

7

160

TB

Racing

N22

G

9

168

TB

Racing

N23

G

7

118

Pony

Experimental

N24

M

10

135

Pony

Experimental

N25

M

6

128

Pony

Experimental

Key:

S = Stallion M = Mare G = Gelding TB = Thoroughbred ID = Irish Draught x = Cross

Key to Tables 2, 2a, 3 and 3a:
N = Number of Feet; SD = Standard Deviation; Min = Minimum value; Max = Maximum value
Angle S = Angle in degrees subtended by dorsal hoof wall with ground
Angle T = Angle in degrees subtended by line of extension of dorsal cortex of distal phalanx with ground
Angle U = Angle in degrees subtended by line of extension of proximal phalanges with ground
Angle H = Angle T minus Angle S
Angle R = Angle T minus Angle U
Imaged d = Distance (mm) between top of dorsal wall marker and proximal limit of extensor process; measuring directly from radiograph
D = Distance (mm) between top of dorsal wall marker and proximal limit of extensor process after correction for magnification
Imaged wt = Distance (mm) from mid point of dorsal cortex of distal phalanx to dorsal wall marker measuring directly from radiograph
WT = wt (mm) after correction for magnification.

Table 2. Statistical description of radiographic measurements of the front feet of normal horses.

Table 2a. Statistical description of radiographic measurements of the front feet of normal horses, according to breed

Variable

1Breed

N

Mean

Median

SD

Min

Max

2 Max Range

Angle S

Pony
Hanoverian
TB
Other

10
12
22
6

53.6
51.6
48.6
50.2

50.5
52.0
49.0
52.5

7.92
3.15
3.51
4.92

45
46
41
43

67.0
57.0
56.0
55.0

4.0
3.0
9.0
3.0

Angle T

Pony
Hanoverian
TB
Other

10
12
22
6

53
50.5
47.6
48

51.5
51.0
48.0
48.0

7.13
3.90
2.09
4.98

45
44
43
42

66.0
56.0
51.0
54.0

3.0
2.0
6.0
2.0

Angle U

Pony
Hanoverian
TB
Other

10
12
22
6

45.1
44.8
43.8
46.3

46.0
46.0
44.5
49.0

4.98
4.17
5.86
5.92

37
38
34
37

52.0
52.0
52.0
52.0

2.0
8.0
9.0
4.0

Angle H

Pony
Hanoverian
TB
Other

10
12
22
6

-0.6
-1.1
-1
-0.2

-1.0
-1.5
-1.0
-0.5

1.84
1.24
2.72
3.66

-3
-2
-7
-5

3.0
2.0
4.0
6.0

2.0
3.0
4.0
11.0

Angle R

Pony
Hanoverian
TB
Other

10
12
22
6

7.9
5.7
3.8
1.7

8.5
5.0
3.5
3.0

5.88
6.04
6.46
3.72

0
-6
-8
-5

18.0
16.0
15.0
5.0

3.0
6.0
14.0
5.0

WT (mm)

***

Pony
Hanoverian
TB
Other

10
12
22
6

13.2
18
16.3
18.4

12.3
17.9
16.3
18.6

1.93
0.72
1.75
1.36

11.1
17
13.9
16.8

16.1
19.1
19.7
20.2

0.6
1.2
1.6
1.2

D (mm)

*

Pony
Hanoverian
TB
Other

10
12
22
6

3.1
3.3
5.2
3.7

2.9
3.1
4.5
3.9

2.21
2.12
1.97
1.44

0
-1.8
2.6
1.7

6.3
6.3
9.7
5.8

3.6
4.4
3.6
4.1

Pony: Adult Height less than 147.3 cm; TB: Thoroughbred or Thoroughbred Cross excluding Hanoverian; - Hanoverian; Hanoverian: Hanoverian or Hanoverian Cross.

Max Range: The Maximum difference (Maximum Value - Minimum Value) found between the front feet of the same animal.

< 0.01, * P < 0.05 when breeds are compared using foot as the unit.

Table 3. Statistical description of radiographic measurements of the hind feet of normal horses.

N

Mean

Median

SD

Min

Max

Angle S

36

49.08

49.0

3.18

40.0

55.0

Angle T

36

48.94

49.0

3.06

42.0

56.0

Angle U

36

42.31

42.5

5.31

27.0

51.0

Angle H

36

-0.14

0.0

1.59

-4.0

2.0

Angle R

36

6.64

5.0

5.64

-2.0

19.0

Imaged wt (mm)

36

18.61

18.0

2.22

13.0

22.0

Imaged d (mm)

36

5.22

6.0

2.79

-2.0

9.0

WT (mm)

36

16.64

16.25

2.01

11.7

20.4

D (mm)

36

4.63

5.1

2.47

-2.0

8.2

Table 3a. Statistical description of radiographic measurements of the hind feet of normal horses, according to breed

Variable

Breed

N

Mean

Median

SD

Min

Max

2 Max Range

Angle S

Pony
Hanoverian
TB
Other

4
12
14
6

49.5
50.6
47.4
49.7

49.5
50.0
47.5
49.5

3.51
2.81
3.35
1.75

46.0
46.0
40.0
47.0

53.0
55.0
52.0
52.0

1.0
6.0
4.0
4.0

Angle T

Pony
Hanoverian
TB
Other

4
12
14
6

50.3
50.2
47.8
48.3

50.0
49.5
48.0
48.5

2.63
3.33
2.86
2.58

48.0
46.0
42.0
45.0

53.0
56.0
51.0
52.0

1.0
4.0
3.0
7.0

Angle U

Pony
Hanoverian
TB
Other

4
12
14
6

43
41.6
44
39.3

42.5
41.5
44.5
41.5

6.48
4.44
3.9
8.31

37.0
35.0
38.0
27.0

50.0
50.0
51.0
47.0

3.0
15.0
10.0
9.0

Angle H

Pony
Hanoverian
TB
Other

4
12
14
6

0.8
-0.4
0.4
-1.3

0.5
0.0
0.0
-1.0

0.96
1.83
0.93
2.07

0.0
-4.0
-1.0
-4.0

2.0
2.0
2.0
2.0

6.0
12.0
1.0
2.0

Angle R

Pony
Hanoverian
TB
Other

4
12
14
6

7.3
8.6
3.8
9.0

7.5
6.0
4.0
7.5

3.86
5.26
4.06
8.44

3.0
4.0
-2.0
0.0

11.0
18.0
11.0
19.0

2.0
3.0
11.0
10.0

WT (mm)

***
=

Pony
Hanoverian
TB
Other

4
12
14
6

13.9
17.8
16.0
17.7

13.9
17.5
15.9
17.5

2.46
1.46
1.02
2.36

11.7
15.9
14.3
15.4

16.1
20.4
17.9
20.4

0.2
1.5
1.3
4.5

D (mm)

*

Pony
Hanoverian
TB
Other

4
12
14
6

2.7
4.3
6.0
3.3

1.8
3.6
6.2
5.1

1.77
2.28
1.29
3.72

1.7
0.0
4.2
-2.0

5.3
7.9
8.2
6.3

3.6
3.6
2.0
1.2

&#9;Pony: Adult Height less than 147.3 cm; TB: Thoroughbred or Thoroughbred Cross excluding Hanoverian; - Hanoverian; Hanoverian: Hanoverian or Hanoverian Cross.

2&#9;Max Range: The Maximum difference (Maximum Value - Minimum Value) found between the front feet of the same animal.

***&#9;P < 0.001, * P < 0.05 when breeds are compared using foot as the unit.

= &#9;&#9;P < 0.05 when breeds are compared using an individual's median value as the unit. 'Other' breeds were excluded from this comparison.

Table 4. Mean founder distance D (mm) for normal horses according to position of feet (N = 25 for fore feet; N = 18 for hind feet)

Left

Right

Fore

4.40 (SD 1.80)

3.88 (SD 2.49)

Hind

4.37 (SD 2.28)

4.90 (SD 2.68)

Table 5. Statistical description of measurements of founder distance D (mm) taken on two horses over a six week period.HORSE N1:

WEEK NUMBER

FOOT

1

2

3

4

5

6

Mean

S.D.

RF

6.4

4.5

ND

3.2

4.6

4.5

4.64

1.142

LF

4.3

4.5

ND

2.7

3.6

3.6

3.74

0.709

RH

6.4

6.8

ND

5.4

5.5

6.5

6.12

0.630

LH

6.5

7.3

ND

7.1

5.7

6.7

6.66

0.623

Mean

5.90

5.78

ND

4.6

4.85

5.33

5.29

SD

1.068

1.486

ND

2.038

0.961

1.520

1.402

HORSE N2:

WEEK NUMBER

FOOT

1

2

3

4

5

6

Mean

S.D.

RF

3.6

4.6

3.2

3.2

4.6

2.7

3.65

0.789

LF

2.7

2.2

0.0

2.6

1.8

1.8

1.85

0.983

RH

5.4

5.8

4.5

4.4

5.3

6.5

5.32

0.794

LH

4.2

6.4

4.6

6.2

6.8

4.5

5.45

1.138

Mean

3.98

4.75

3.08

4.10

4.63

3.88

4.07

SD

1.133

1.857

2.147

1.588

2.095

2.079

1.732

 Key: ND = No measuerments were taken; SD = Standard Deviation

Table 6. Measurements of D (mm) at varying proximo-distal projection obliquity.

Height of beam above ground (mm)

Week 1

Week 2

Week 3

Week 4

98

3.2

3.2

4.6

2.7

125

4.6

3.2

4.6

2.6

158

5.5

3.2

5.4

3.1

&#9;All measurements were taken from radiographs of the right fore foot of horse N2.

Table 7.Measurements of D (mm) at varying dorso-palmar projection obliquity.

Dorsal

Palmar

Angle of obliquity in degrees:

20

13

5

0

5

13

20

Foot

RF

3.8

3.7

3.7

3.6

3.6

3.8

3.9

LF

3.0

2.6

2.7

2.7

2.7

3.0

2.6

RH

5.4

5.0

5.4

5.4

5.8

5.6

5.4

LH

4.6

4.0

4.4

4.2

4.4

4.2

4.2

 Table 8. Correlations between foot width, foot length, horse height, founder distance and wall thickness.

Foot Width

Foot Length

Horse Height

Founder Distance

Wall Thickness

Foot Width

1.0


Foot Length

0.909**

1.0


Horse Height

0.885**

0.764**

1.0

Founder Distance

0.117

0.068

0.097

1.0

Wall Thickness

0.839**

0.746**

0.775**

0.048

1.0

&#9;[** denotes a statistically significant correlation at P < 0.01]

Table 9: The effect of different operators on Measured founder distance D (mm)

Table 10: Morphometric comparison between Eustace and Cripps and Linford (Mean +/- Standard Deviation)

Eustace & Cripps 1998

Linford 1987

Angle S

50.5 +/- 5.0

48.2 +/ 2.6

Angle T

49.4 +/- 4.7

47.8 +/ 3.0

Angle U

44.6 +/- 5.2

50.5 +/ 4.7

Angle H

-0.86 +/- 2.4

-0.5 +/- 1.3

Angle R

4.8 +/- 6.1

2.7

Wall Thickness (mm)

16.3 +/- 2.4

14.3 +/- 1.0