 |
THIS
TABULAR DATA RELATES TO THE PAPER ABSTRACTED FROM THE SCRUTINEERED VETERINARY JOURNAL
EQUINE VETERINARY JOURNAL
Equine vet. J. (1999) 31. 5. pp 433-442 FACTORS INVOLVED IN THE PROGNOSIS OF LAMINITIS IN THE UK ROBERT A EUSTACE B.V.Sc. Cert.E.O. Cert.E.P. FRCVS. The Laminitis Clinic, Mead House Farm, Dauntsey, Chippenham, Wiltshire. SN15 4JA. P.J. CRIPPS B.V.Sc. B.Sc. M.Sc. PhD. MRCVS. University of Liverpool, Department of Veterinary Clinical Science and Animal Husbandry, Leahurst, Neston, South Wirral, L64 |
|
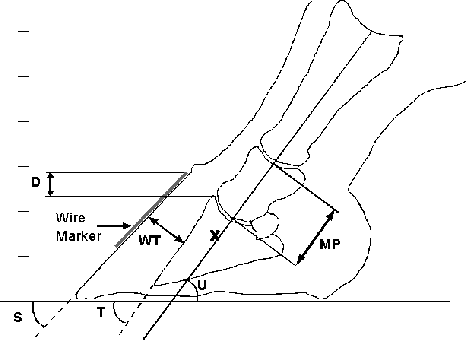
Figure 1: Diagram to show how the Various Radiographic Measurements were made |
||
 |
||
|
Key: D
= Founder distance, WT = Wall Thickness
(both before correction for magnification) |
||
|
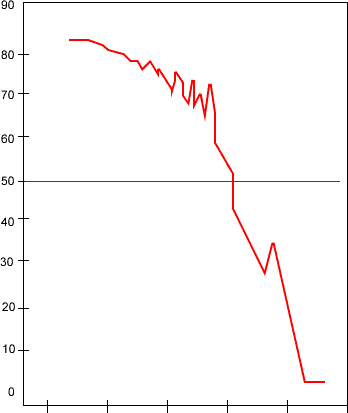
Figure 2: Percentage Success For Acute Founder % Success for Founder Distance Greater than or Equal to the value Given |
||
|
|
||
 |
||
|
|
||||||||||||||||||||
|
|
||||||||||||||||||||
|
Table 1 Distribution of cases by breed and outcome |
||
|
||||||||||||||||||||||||||||||||||||||||||||||||||||||||||||||||||||||||||||||||||||||||||||||||||||||||||||||||||||||||||||||||||||||||||||||||||||||||||||||||||||||||||||||||||||||||||||||||||||||||||||||||||||||||||||||||||||||||||||||||||||||||||||||||||||||||||||||||||||||||||||||||||||
|
Table 2 Distribution of cases by cause and outcome |
||
|
||||||||||||||||||||||||||||||||||||||||||||||||||||||||||||||||||||||||||||||||||||||||||||||||||||||||||||||||||||||||||
|
Table 3 Distribution of cases by duration and outcome (duration is the time from onset until referral to the clinic) |
||
|
||||||||||||||||||||||||||||||||||||||||||||||||||||||||||||||||||||||||||||||||||||||
|
Table 4. Distribution of cases by age and outcome |
||
|
|||||||||||||||||||||||||||||||||||||||||||||||||||||||||||||||||
|
Table 5 Distribution of cases by sex and outcome |
||
|
||||||||||||||||||||||||||||||||||||||||||||
|
Table 6. Distribution of cases by Clinical Group and Outcome |
||
|
||||||||||||||||||||||||||||||||||||||||||||||||||||||||||
|
Table 7. Distribution of cases by Grade of Lamenes and Outcome |
||
|
||||||||||||||||||||||||||||||||||||||||||||||||||||||||||||||||||||||||
|
Table 8 Distribution of cases by Horse or Pony and Outcome |
||
|
||||||||||||||||||||||||||||||||||||||||||||
|
Table 9. Distribution of cases by Clinical Group, Horse or Pony and Outcome |
||
|
||||||||||||||||||||||||||||||||||||||||||||||||||||||||||||||||||||||||||||||||||||||||||||||||||||||||||||||||||
|
1 Percent in each clinical group for all animals, horses and ponies respectively TABLE 10 THE ABILITY OF DIFFERENT VARIABLES TO PREDICT OUTCOME Predictors were chosen using forward stepwise logistic regression. Additional predictors increased the overall accuracy and significantly (P < 0.05) reduced the residual deviance. Where group membership was used as a predictor the predicted outcome was the most prevalent one for that group. |
||
|
||||||||||||||||||||||||||||||||||||||||||||||||||||||||||||
|
D:
Founder Distance in mm 1 The best fit model when group membership is not included. All 8 stallions were successes. 2 The best fit model when group membership and Sex are excluded. |
||